

















下载地址
https://api.skillhub.cn/api/v1/download?slug=%40user_ca803213%2Fknowledge-graph-visualizer-skill将提示词发送给你的 AI 安装该 skills
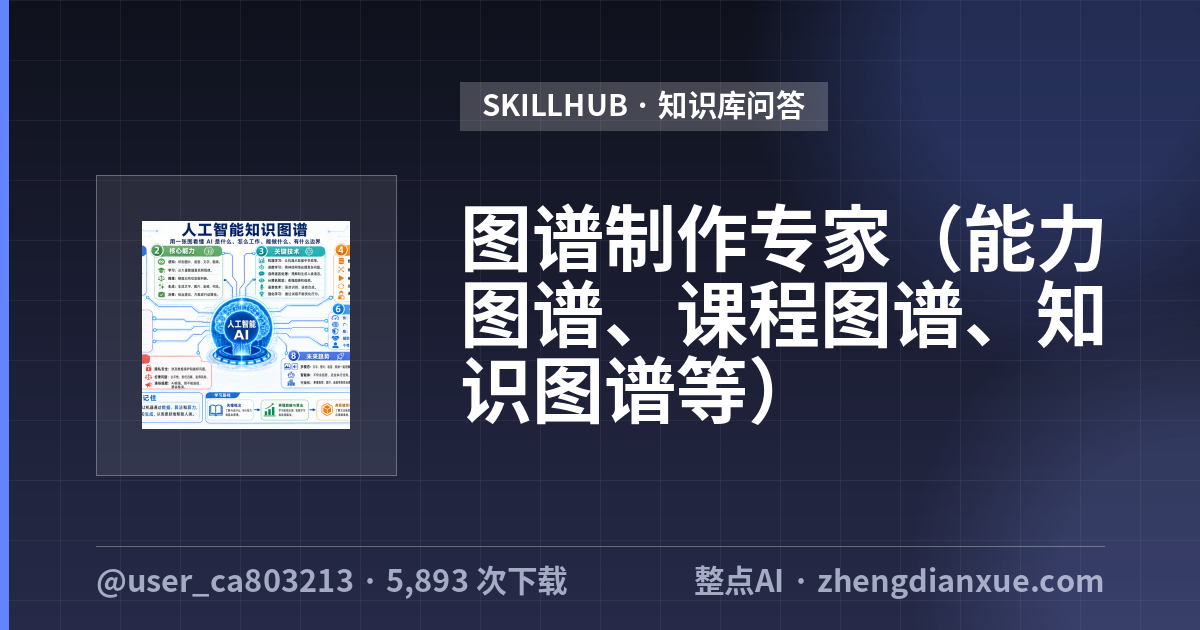
请根据 https://skillhub.cn/install/skillhub.md,安装 @user_ca803213/knowledge-graph-visualizer-skill。将结构化 JSON 知识图谱数据(nodes + edges + metadata)转换为多种可视化格式输出:单文件交互式 D3.js 力导向 HTML 页面、Mermaid 代码、Graphviz DOT 代码、Markdown 层级树、静态图谱图片提示词,以及可复用的原始 JSON。适用于能力图谱建设、课程知识图谱、概念关系图、知识地图等各类图谱的生成与可视化展示。
阅读全文 (展开查看完整说明)
概述
Knowledge Graph Visualizer
Purpose
Transform a unified graph JSON dataset into coordinated multi-format visualization output.
Use this skill for:
- Creating a course knowledge graph in HTML format.
- Generating stage-two visualization output from stage-one JSON data.
- Converting
nodes + edges + metadatainto interactive webpage, static image prompt, Mermaid, Graphviz, and Markdown hierarchy. - Producing reusable knowledge graph assets for teaching, research, courseware, or concept explanation.
Required Input
Accept either:
- A complete stage-one JSON object containing
nodes,edges, and optionalmetadata. - A course/topic name only, in which case first construct a stage-one JSON knowledge graph without changing the stage-two schema.
Required JSON schema:
{
  "graph_type": "knowledge_graph",
  "topic": "课程或主题名称",
  "metadata": {
    "title": "图谱标题",
    "description": "图谱说明",
    "created_for": "教学/研究/展示",
    "version": "1.0"
  },
  "nodes": [
    {
      "id": "stable_node_id",
      "label": "节点名称",
      "type": "节点类型",
      "level": 0,
      "description": "节点详细描述"
    }
  ],
  "edges": [
    {
      "source": "source_node_id",
      "target": "target_node_id",
      "relation": "关系名称"
    }
  ]
}
Rules:
- Preserve the same JSON data across all output formats.
- Do not modify graph data during visualization generation.
- Do not omit any node or edge.
- Keep IDs ASCII-compatible where possible for Mermaid and Graphviz stability.
- Use
level: 0for the root/core concept,level: 1for major modules,level: 2for subtopics, andlevel: 3for examples, methods, cases, or applications.
Default Course Graph Construction
When only given “做出某某课程的知识图谱” or similar input, first create a practical course graph:
- Root node: course name, type
课程, level0. - Level 1 nodes: 4-7 major teaching modules, type
模块. - Level 2 nodes: 2-4 knowledge points under each module, type
知识点. - Level 3 nodes: methods, cases, activities, assignments, or assessment items, type
方法/案例/活动/评价. - Add prerequisite, supports, applies_to, includes, and cross-domain edges where meaningful.
- Keep the graph readable: usually 18-35 nodes and 20-45 edges for one course unless the user requests more.
Output Order
Always output in this order:
- Raw JSON data.
- Mermaid code.
- Graphviz DOT code.
- Markdown hierarchy.
- Interactive single-file HTML.
- Static graph image prompt or generated image, depending on available tools.
When producing a file deliverable, save it under the current workspace output path and present it for review.
Interactive HTML Requirements
Generate a single-file HTML page using D3.js force simulation and SVG rendering. D3 may be loaded by CDN.
Required features:
- Drag nodes freely to adjust layout.
- Mouse wheel zoom and pan for local detail.
- Click node to show
node.descriptionin a detail panel or popup. - Click node to highlight connected edges and neighbor nodes while dimming unrelated graph elements.
- Force-directed layout where dense relations cluster naturally.
- Node color grouped by
type; include a legend. - Edge labels display
relation. - Top bar displays graph title, node count, and edge count.
- Search box locates nodes by keyword and highlights matching results.
- Reset layout button restores simulation, zoom, and selection.
- Directed curved edges use arrow markers.
Visual standards:
- Use white or light gray background.
- Use clear Chinese-compatible font stack:
Microsoft YaHei,PingFang SC,Noto Sans CJK SC,Arial, sans-serif. - Node radius reflects hierarchy: level 0 largest, deeper levels smaller.
- Use a stable type-color palette. Same
typealways maps to the same color. - Keep labels readable and avoid low contrast.
- Use curved links and arrowheads for directed relationships.
- Keep layout responsive for desktop and browser preview.
Recommended D3 structure:
- Embed the JSON in a
<script type="application/json" id="graph-data">tag or JavaScript constant. - Build
nodeByIdmap before creating links. - Use
forceLink(edges).id(d => d.id).distance(...),forceManyBody,forceCenter, andforceCollide. - Apply zoom behavior to a root
<g>layer. - Add
marker-endarrowheads to links. - Use separate SVG groups for links, link labels, nodes, and node labels.
- Implement
dragstarted,dragged,dragended,highlightNode,resetHighlight,searchNode, andresetLayoutfunctions.
Static Image Prompt Requirements
When image generation is available, create a static graph image from the same JSON data. If direct image generation is not available, output a complete image-generation prompt.
The prompt must explicitly include:
- Topic/title.
- Complete node list with type and hierarchy.
- Complete edge list with relation labels.
- Color scheme by node type.
- Force-directed / Neo4j-like layout style.
- Clean high-contrast background.
- Chinese labels must be crisp and readable.
- Curved links with relationship labels.
- Overall balanced composition.
Prompt template:
生成一张课程知识图谱静态图片,主题为「{title}」。采用 Neo4j 风格力导向布局:节点为圆形,按 type 分类着色,level 0 最大,level 越深节点越小;连线为曲线并带箭头,边上显示 relation 标签;背景为白色或极浅灰,整体高对比度,中文标签清晰可读。

节点列表:
{node_list}

关系列表:
{edge_list}

颜色方案:
{type_color_mapping}

构图要求:核心节点居中,一级模块环绕核心节点,二级/三级知识点围绕所属模块分布,跨域关联以细虚线或浅色曲线表示,整体平衡、清晰、美观。
Mermaid Generation Rules
Choose diagram type:
- Knowledge graph / relationship graph / concept graph:
graph TDorgraph LR. - Mind map:
mindmap. - Process / architecture:
flowchart TD.
Default for course knowledge graph: graph TD.
Rules:
- Define each node by node id and label:
node_id((节点标签)). - Use
source -->|关系| targetfor normal directed edges. - Use
source -.->|关系| targetfor cross-domain or non-hierarchical associations. - Add
stylestatements for core nodes and level-based fill colors. - Keep Mermaid IDs ASCII-friendly. If source IDs include hyphens or spaces, normalize them for Mermaid while preserving labels.
Example:
graph TD
  course((课程名称))
  module1((模块一))
  course -->|包含| module1
  style course fill:#1a73e8,color:#fff,stroke:#0b3d91,stroke-width:2px
  style module1 fill:#e8f0fe,color:#111,stroke:#5b8def
Graphviz DOT Generation Rules
Generate valid DOT code:
digraph KnowledgeGraph {
  graph [rankdir=TD, bgcolor="white", splines=true, overlap=false];
  node [shape=circle, style="filled", fontname="Microsoft YaHei", fontcolor="#111111"];
  edge [fontname="Microsoft YaHei", color="#8a8f98", fontcolor="#4b5563", arrowsize=0.7];

  course [label="课程名称", fillcolor="#1a73e8", fontcolor="white"];
  module1 [label="模块一", fillcolor="#e8f0fe"];
  course -> module1 [label="包含"];
}
Rules:
- Use
digraphfor directed graphs. - Configure
shape,fillcolor,fontcolor, andfontname. - Add edge labels using
label="关系". - Choose
rankdir=TDfor hierarchical course graphs andrankdir=LRfor process/architecture graphs. - Quote labels and escape special characters.
Markdown Hierarchy Rules
Convert graph into a readable tree:
- Start from root node (
level: 0). - Use nested
-list indentation. - Add emoji by type for readability.
- Show cross-domain links as
← 来源:关系or↔ 关联:关系. - Keep descriptions short unless the user asks for detailed notes.
Default emoji mapping:
- 课程: 🎓
- 模块: 📦
- 知识点: 🧠
- 方法: 🛠️
- 案例: 🧩
- 活动: 📝
- 评价: ✅
- 领域: 🌐
- 核心分支: 🔷
- 概念: 💡
Consistency Checklist
Before final output, verify:
- HTML contains drag, zoom, click detail, neighbor highlight, search, reset, legend, title, counts, relation labels, directed curved links.
- Static image prompt or generated image includes every node and edge.
- Mermaid syntax is renderable.
- Graphviz DOT syntax is renderable.
- Markdown hierarchy reflects the graph structure and cross-links.
- Node count and edge count match across all outputs.
- Raw JSON is complete and reusable.
- Visual style is unified and readable.
Safety and Constraints
- Do not require a backend server.
- Do not generate hidden scripts, installers, shell commands, or dependency installation steps inside the skill output.
- Do not read sensitive files or personal directories.
- Keep generated HTML self-contained except for D3 CDN.
- Do not modify source graph data during stage-two visualization.